This post is from some quick notes I made in August 2018. I’m only just getting around to publishing it now, 8 months later, as part of this series. Today, at ~230 pounds, 215 seems like a dream.
—
I’m recently back from traveling to Denmark and France to attend two Parkour events back-to-back. As usual when I’m traveling, I don’t attempt to keep up my normal routines so there’s no data recorded for most of July 2018.
I’m happy to return still around 215 as I try to get back to my routine of “chaining together” my mornings. Compared to July, I’m not as active, but I’m trying to AVOID the, “let’s be super active and try the 100-days-of-activity challenge,” mistake I made in 2017 when I came home from the same events all excited about movement.
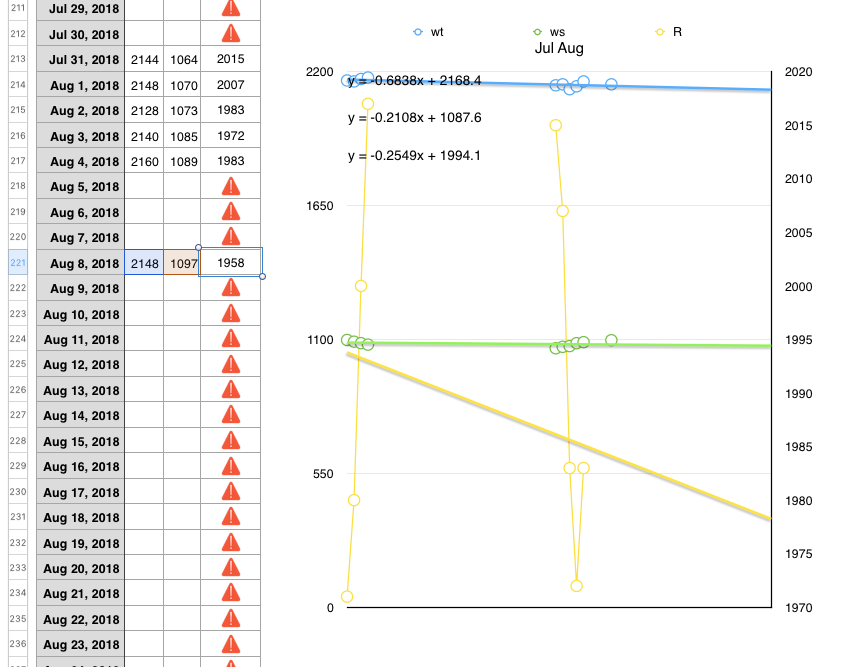
Anyway, what about that ratio of 1958? …it’s so low that it’s not even on the graph! This reminds me of two things I believe I’ve noticed:
- The ratio lags behind when I’m actively losing weight. My guess is that the different components (water, subcutaneous fat, visceral fat, and muscle) change at different rates. So when losing fat from calorie deficit, the peripheral/subcutaneous is liberated first—which aligns with my recollection that visceral fat is more tenacious.
- The best ratio is very hard to find—to actually see it in the measurements. I have to lose weight gradually, and then stay at the new weight for many weeks to see the ratio rebound to above 2000. (Reminder, the ratio is in wacky units of “tenths of pounds per millimeter midriff circumference” because of how I record the numbers. The numerical value of the ratio is of no concern; It’s only useful for trending.)