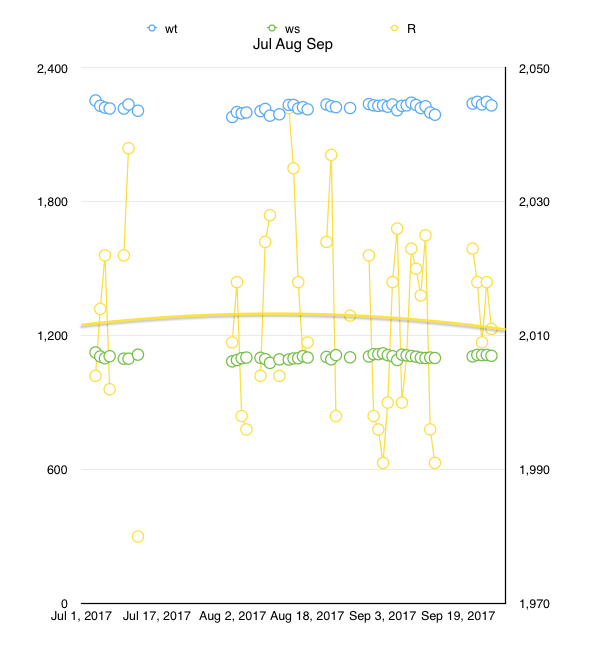
Sneak peek at something I’m writing up from a year-long experiment. This is a graph of weight and waist measurements (plotted on the left in non-obvious units), and the ratio of those numbers (plotted on the right, x1000; so “2000” is a 2:1 ratio in the weird units of course) The measurements jump all over the place, but when I measure every day, a polynomial curve fit shows what’s going on over this three month window. Much much more to write about this…
ɕ